Friday, October 21, 2016

Lab 15 Collisions In Two Dimensions

Student: Xavier Lomeli
Partners: Matthew Ibarra, Billy Justin
Date of Lab: 19 October 2016 
Lab 15 Collisions In Two Dimensions
Mission Statement:To observe two-dimensional collisions and determine if momentum and energy are conserved.
Theory: The theory behind this lab involved the determination of whether momentum and energy were conserved in this collision. Assuming a perfectly inelastic collision, the final momentum and energy of the system should equal the initial.
Experimental Procedure for Part 1:
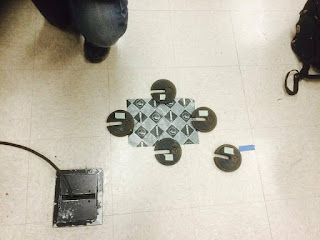
For this lab, we set up an apparatus depicted in the image below
-2 marble of mass 0.02 kg
-1 steel ball of ass 0.07 kg
-square glass table of length 62.5 cm
Data
a) Different mass collision.
1. We recorded a video of the collision, uploaded it to loggerpro, then set the frame rate to 240, enough to make good data points using the dot function to track the movement of both balls.


On the left side of the above picture is the Vo of both x and y components of both balls, while the right side of the picture is the Vf of both x and y components of both balls. Next, using the data set from the video, we plotted two graphs. One is the x and y center of mass position vs time graph the other is the x and y center of mass velocity graph.Nonetheless, we could have also gathered this data using x/y velocity/position cm = (M1*x/y velocity/position + M2* x/y velocity/position) / total mass.

Next we want to kno if momentum and kinetic energy is conserved in the system.
-for momentum we designed 2 graphs through the use of the formula we had placed in the calculated column using M1*(x/y) velocity.
For Kinetic Energy we also plotted a graph using another formula, 0.5*M1*(x-velocity^2 + y-velocity^2) + 0.5*M2*(x-velocity^2 + y-velocity^2)
If indeed momentum and energy were truly conserved  then we should anticipate a graph which looks like a horizontal line, but given the amateur nature we instead obtained a scattered graph, shown below.
Conclusion-Sources of error in our experiment likely revolved around the actual elasticity of the collision, air resistance, and non-dead-on impacts, even if not discernible by our eyes.

Wednesday, October 19, 2016

Lab 14 Ballistic Pendulum

Student: Xavier Lomeli
Partners: Matthew Ibarra, Billy Justin
Date of Lab: 12 October 2016 
Lab 14 Ballistic Pendulum
Mission Statement:To determine the firing speed of a ball from a spring-loaded gun.
Theory: In this lab, we were examining an inelastic collision in which momentum is supposedly conserved when a small steel ball, moving at some unknown velocity, is propelled into and absorbed  by a nylon block , in turn imparting its kinetic energy into the nylon block, which in turn rises through some angle that we measured. 
Experimental Procedure:
Below is the setup of our experiment.
 As shown in the picture above, the mechanism involves a notched spring-notch bolted with three different notch settings. The nylon block is suspended by four vertical strings, themselves attached to a protruding plate with tighteners on it to modify the tension on each string. Also attached to the protruding plate was the angle indicator. After properly setting up the system, we pulled the punch to the third notch, inserted the steel ball, stabilized the nylon block, aligned the angle indicator, got behind the punch, and fired away.
We failed multiple times to have the ball lodge itself within its designated slot in the nylon block, but after about seven attempts we finally succeeded in conducing a supposedly inelastic collision between the two. After getting another four successful inelastic collisions, we proceeded to get an average. We carried out our calculation using the information we collected from our trials (namely the angle and mass of the ball and block), shown below.


We obtained a velocity of 6.04 m/s.
Next, we calculated the propagated uncertainty of our experiment, shown below.
As shown above, the calculated uncertainty in our answer was +/- 0.15 m/s
Lastly, we were supposed to find out the actual distance the ball would travel by conducting a projectile motion trail and accompanying calculation, shown below.


Conclusion: 
Following our projectile motion problem, we observed that the firing velocity of the steel ball had to be within 0.15 m/s of our value calculated using conservation of momentum equations. Sure enough, we were approximately 0.1 m/s off, which is within our propagated uncertainty tolerance. Sources of error would doubtlessly include the asymmetric application of tension by each string regardless of how evenly we tried to tighten and align them, followed by the possibility that an external force did indeed act on the system while the steel ball impacted the nylon block, thus rendering this collision not truly inelastic.  

Friday, October 14, 2016

Lab 13 Magnetic Potential Energy Lab

Student: Xavier Lomeli
Partners: Matthew Ibarra, Billy Justin
Date of Lab: 12 October 2016 
Lab 13 Magnetic Potential Energy
Mission Statement:To verify that conservation of energy applies to a system involving MPE (magnetic potential energy) and to find an equation to model MPE.
Theory: Every kind of calculation is in truth an approximation, and the tolerance of uncertainty depends on the application the calculation will be for. When multiple calculations are involved, then the uncertainty ripples, or propagates, through to the final result. Learning the method by which this kind of propagated uncertainty is determined is the essence of this lab.
Experimental Procedure:
First, we set up our apparatus to conduct our experiment as shown below.

We positioned books underneath the air track so that the glider would attain an angle θ, thereby obtaining GPE (gravitational potential energy) before beginning its descent. On the impact side of the glider, we attached a magnet of the same polarity as the fixed magnet on the bottom of the slope, shown below.

When the air track is activated, the glider was suspended on a cushion of air, ensuring that friction was negligible during its descent. During the descent, the glider gained KE (kinetic energy) up until the glider reached some equilibrium point some distance r from the bottom of the slope where the repulsion force between the magnets matched the force of gravity continuing to pull the glider down farther still, shown below.


We collected the appropriate data (r, h, θ) by tilting the track at different angles for different trials so that we could plot a relationship between the magnetic force F and the separation distance r. Before we plotted the graph, however, we first assumed that this relationship takes the form of a power law, namely A*e*r^n. Below is our graph. 

From our graph, the values for A and B were 0.0001863 and -0.1128,  respectively, and the appropriate function U(r) for the interaction between the magnets would thus appear to be 0.0001863*r^-1.872. 
Next, we set up our experiment such that we positioned a motion detector to record the position and velocity of the descending glider. Furthermore, we were supposed to determine the relationship between the distance the motion detector reads and the separation distance between the magnets, shown below. 
 The relationship to determine r is s-k, which we found with the help oft the motion detector and then proceeded to position the cart at the far end of the track, where we started the detector and gave the glider a light push, recording the data needed to verify conservation of energy for the time before, during, and after the collision. We then proceeded to make a single graph showing KE, MPE, and total energy of the system as a function of time, shown below.

Conclusion- From our graph above, we showed how the relationship between MPE and KE is fairly close. The behavior of the curves corresponds with the concept of conservation of energy since the KE and MPE curves seem to be inversely related as expected.
Predominant sources of error would include the overzealous application of too much 'pushing' force when the block is initially resting atop the elevated edge of the air track, thereby introducing an external force into our supposedly closed system, and furthermore the possibility of measurement errors in determining the distance r.

Lab 12 Conservation of Energy

Student: Xavier Lomeli
Partners: Matthew Ibarra, Billy Justin
Date of Lab: 5 October 2016 
Lab 12 Conservation of Energy
Mission Statement:To look at  the energy in a vertically-oscillating mass-spring system, where the spring is a non-negligible mass.
Theory:Since we must now consider the spring into our calculations, calculus is required to identify the show that the GPE of the spring is mg(H+y)/2 and that the KE of the moving spring is described formulaically by (1/2)((1/3)m_spring)*v^2. If energy is truly conserved, then the graphs of each energy involved (GPE, KE, and EPE) should reflect this conservation.
Experimental Procedure:
For this experiment, we hung a 200 g mass onto a hanger so that the total hanging mass was 250 g, shown below.

Directly below the hanging mass, on the floor, we placed a motion sensor which could detect the movement of the hanging mass as it osscilated back and forth, shown below.

We proceeded to pull the spring down about 10 cm before releasing and recording the position and velocity v. time graphs, aligning them appropriately. However, before we did this, we drew sketches of how we predicted each energy graph to look like, together with the aforementioned position and velocity graphs, shown below.
Since the hanging mass is initially displaced some distance, we predicted that the position graph would be some variant of the cosine function, and since the velocity is initially zero, we assumed its graph would be some variant of the sine function. Likewise, since the velocity is initially zero, we predicted  that the kinetic energy graph would likewise start at y = 0, but would possess a period twice as rapid since the spring stretches twice during each oscillation. Conversely, the gravitational potential energy would be substantial in the beginning, but diminish down to zero as the hanging mass reached the lowest point of its stretch.

Shown below, we proceeded to plot the KE(purple), GPE(orange), and EPE(red) graphs together,  to see if our predictions were accurate.

 As we can see from the plot above, our predictions were quite accurate indeed, with the general shape of each energy graph corresponding well with our predictions except for the odd discrepancy between the amplitude of the KE graph and the other two graphs, which is most likely due to the paper taped to the falling mass briefly falling out of the sight range of the motion detector.
Next we used LoggerPro to produce plots of KE, GPE, and EPE verses distance and KE, GPE, and EPE verses time, respectively. However, before doing this, we drew sketches of our predictions, shown immediately down below.
With these predictions in mind, we found the graphs themselves below.

Above we see the respective GPE and EPE verses position graphs, and the trends correspond with our predictions, which indicated an inverse relationship between the two.
With regards to the kinetic energy verses position, we received exactly what we expected, increasing up until the equilibrium position of the string is reached, then slows down until the sting is fully stretched with the given hanging mass.
With regards to the GPE and EPE verses velocity graphs, we see that they correspond directly, which is to be expected.

Next, above, we see our graph of the kinetic energy verses velocity, which is the opposite of the graph of the velocity verses position, as expected.
Below we made a new column to contain the sum of all the energies, known as E_sum, and we found the relationship between E_sum(blue) and time and space.
Above, we see how the sum of the energies is a horizontal line, which corresponds with the notion that energy is conserved.

Lastly, above we see the sum of the energies with respect to velocity, which seemingly yields a horizontal circle, again coherent with the idea of energy conservation.
Conclusion- The most obvious source of error in our experiment unquestionably came from how the paper attatched to the bottom of the hanging mass to be detected by the motion sensor as it either ascended or descended sometimes would stray away from the line of sight of the motion sensor. Furthermore, the paper itself was not flat against the hanging mass, but rather only attatched at a point, with the edges of the paper dangling considerably. It  is entirely possible that the senor detected these dangling edges rather than the flat middle during different trials, thus introducing another source of error.
Even so, the premise of the lab was satisfied in the sense that we obtained graphs whose respective qualities were correctly related, either inversely or directly. We showed how energy is conserved within the system, thus validating our theory.

Thursday, October 13, 2016

Lab 11 Work-Kinetric Energy Theorem Activity

Student: Xavier Lomeli
Partners: Matthew Ibarra, Billy Justin
Date of Lab: 5 October 2016 
Lab 11 Work-Kinetric Energy Theorem Activity
Mission Statement:To determine the relationship between kinetic energy and work done. .
Theory: Every kind of calculation is in truth an approximation, and the tolerance of uncertainty depends on the application the calculation will be for. When multiple calculations are involved, then the uncertainty ripples, or propagates, through to the final result. Learning the method by which this kind of propagated uncertainty is determined is the essence of this lab.
Experimental Procedure: This experiment actually consists of three different experiments, listed below, using the apparatus shown below.

Experiment 1: For the first segment, we measured the work done by stretching a spring accross a measured distance. We collected data for the force applied by a stretched spring verses the distance the spring is stretched an approximate distance of 0.6 meters, calculating the work done by finding  the area under the force v. distance graph, shown below. 


From our graph, we were able to identify
(a) our spring constant, which we  from the slope of the curve-fit line, here shown to be 5.794 Newtons/meter, which is reasonable.
(b) the work done, obtained through the integration routine of our function, which returned the result of 0.6455 Newtons*meter, or 0.6455 Joules.
Experiment 2
For the second experiment,  we weighed the cart, and then inputted the kinetic energy formula into our file. Conducting the experiment again, we obtained the graph below.
From the above graph, we determined that, from the 0.17 meter mark to 0.51 meter mark, the total work done was equal to 0.6316 Joules while the change in kinetic energy (shown in the above graph as the point corresponding to the 0.17 mark) was recorded as 0.825 Joules, which is just under 25% higher than the supposed work done. We proceeded to find the corresponding values of work and kinetic energy for two other position intervals, shown below.
For the above interval from x = 0.311 to x = 0.51, the work done is  0.4491 Joules and the kinetic energy is 0.595 Joules, which shows that our value for kinetic energy is 26.1 % higher than our work value. 
From the above interval from x = 0.420 to x = 0.51, the work done is  0.2323 Joules and the kinetic energy is 0.294 Joules, which shows that our value for kinetic energy is 21.2 % higher than our work value.
Below is a table of our collected data. 

Conclusion- The very significant percent difference between our work and kinetic energy likely has to do with inadequacies in our setup and/or equipment. Furthermore, we were supposed to stretch the spring by 60 cm, which we perhaps slightly overshot or undercut. Nevertheless, for our three different intervals, the percent difference stayed approximately consistent in the mid-twenties.
Regardless, what was supposed to happen is to show how the work done by the cart and spring system is equal to the change in kinetic energy of the cart and spring system.

Saturday, October 8, 2016

Lab 8

Student: Xavier Lomeli
Partners: Matthew Ibarra, Billy Justin
Date of Lab: 7 September 2016 
Propagated Uncertainty in Measurements
Mission Statement:To verify the equation F = m*r*w^2
Theory: When an object moves in a circle at a constant speed its velocity (which is a vector) is constantly changing. Its velocity is changing not because the magnitude of the velocity is changing but because its direction is. This constantly changing velocity means that the object is accelerating (centripetal acceleration). If the object is accelerating, then it must be subject to some force.
Experimental Procedure:
 For this experiment, the procedure was rather straightforward, basically involving us spectate as the professor made use of a spinning-table mechanism (shown below) on which a block was tethered to the central rotating rod, and depending on the distance between the block and center of rotation, or depending on the weight of the block, or depending on the angular velocity of the rotation, different readings for the force would be recorded by us.
 The professor would conduct the experiment 10 different times, holding the mass constant for the first 8 times and the radius of rotation constant for the 5-10th trials. Together with the values for the force and time, we built a table in Excel calculating the angular velocity we reached, together with the quantities w^2, rw^2, mw^2, and mr shown below.


Next, we plotted the graphs of Force verses rw^2, Force verses mw^2, and Force verses w^2, whose slopes should yield m, r, and mr, respectively. The graphs are shown below.
Lists/Tables/Graphs of Collected Data with Explanation:
Graph of Force verses r*w^2
Below the slope is shown to be 0.2026, which corresponds nearly exactly with the weight of the block when the weight was held constant. 
 Graph of Force verses m*w^2
 Below the slope is shown to be 0.8249, which did not correspond very well with the radius of the block when the radius was held constant at 0.58 m. 
Graph of Force verses w^2
 In the graph below, the value of A is approximately equal to 0.1249, which is fairly close to our expected value of m*r = 0.116. 


Conclusion- The difference between our 'slope' values and their corresponding 'recorded' values, can best be attributed to poor timekeeping and insufficiently advanced equipment. The mechanism which spun the horizontal, circular table relied upon fixed wheels underneath the table to exert the spinning force, thereby increasing the number of places were the circular table touched another surface tand thereby experienced friction. I suppose if we had a mechanism in which the circular table connected directly with the rotating axle rod, there would be less friction and thus a more accurate reading of the angular velocity.

Tuesday, October 4, 2016

Lab 9 Centripetal Force

Student: Xavier Lomeli
Partners: Matthew Ibarra, Billy Justin
Date of Lab: 3 October 2016 
Centripetal Force
Mission Statement:To determine the relationship between the angle theta and the angular velocity of the system.
Theory:When an object is spun around a fixed axis, the object is subject to a centripetal acceleration which propels the object farther and farther from the axis of rotation until the opposing forces supplied by gravity and the string balance the outward motion.
Experimental Procedure:
 In order to determine the relationship between the angle theta and the angular velocity of the system , we utilized a system involving a tripod which, when powered via electric motor, spun a ball around its axis at different angular velocities, which in turn yielded two quantities, namely the angle theta and the height h, depicted below.
 From the above diagram, it is evident that the angle theta and the height h varied depending on the angular velocity of the ball being spun around the tripod. We first collected the data which we could obtain directly before beginning the experiment, namely the fixed height H, the horizontal distance R, and the length of the string L. With these measurements, we could then proceed to symbolically solve for the angular velocity, shown below.
The above equation, w = sqrt((g*tan(theta))/(r+L*sin(theta)), does not depend on time, but rather the difference in heights (H-h) and the specific angle theta for that particular instant, shown below.
While the above equation we derived does link the angular velocity with the angle theta, thereby satisfying our mission to establish a relationship between the aforementioned quantities, we had yet to confirm if our derived equation could accurately model reality.
In order to do so, we needed to solve for omega  using a different method first, then determine if the resulting value approximately corresponded with or ideally even matched the value calculated via our derived equation. This method involved counting the time transpired for the ball to complete ten revolutions around the axis and then multiplying this ratio by the unit definition of angular velocity, shown below.
This equation provided an alternative way of determining the angular velocity. Next we proceeded to watch the professor perform trial after trial, shown below.

 During each new trial, the professor increased the power being provided to the spinning mechanism, thereby outstretching the ball further and changing the magnitudes of theta and h. We recorded all relevant information from each trial and then proceeded to type in this data into Excel, with two distinct columns for the omega calculated using our derived equation with respect to the angle theta and for the omega calculated using the known temporal relationship between angular velocity and the number of revolutions per seconds transpired. Below is the completed table.
The two rightmost columns, w(t) and w(h), show the calculated values using the temporal relationship and the theta relationship, respectively. We then proceeded to plot these two columns against each other and determine if the slope looked linear. If it did indeed seem linear, then this would imply that there is an approximately one-to-one correspondence between the two equations, thereby providing confirmation that our derived equation does indeed model reality effectively. Below is the graph.
From this graph, we can plainly see that the slope of the w(h) verses w(t) curve is within 5% of one. This implies that the w(h) equation, our derived equation, yields a result which is consistently 5% higher than the result we would find using w(t), the temporal relationship equation. 

Conclusion- The 5% difference between our w(h) and w(t) values can best be attributed to a number of systemic deficiencies and environmental forces which were neglected from our derivation.In terms of systemic deficiencies, the most obvious involve the oscillating, swaying motion experienced by the ruler of protruding length R when the spinning motion becomes more intense. Under such circumstances, the height H would tend to be lower than previously presumed.
Under the opposite circumstances, when the axis is being spun very slowly, the counterweight on the opposite end of the ruler of protruding length R might have actually caused the height H to be higher than previously presumed.
Furthermore, with regard to the environmental forces in play, the most obvious force we deliberately neglected is air resistance. How significantly air resistance affected the motion of the ball is difficult to discern, but it can be inferred that for the higher angular velocity trials, the air resistance mattered more.
Lastly, human error and poor timing coordination during the stop-watch phase of the lab likely contributed to the discrepancy. 

Saturday, October 1, 2016

Lab 6 Trajectories

Student: Xavier Lomeli
Partners: Matthew Ibarra, Billy Justin
Date of Lab: 19 September 2016 
Trajectories
Mission Statement:To use my understanding of projectile motion to predict the impact point of a ball on an inclined board. 
Theory: Through experimentation, we were supposed to confirm the effectiveness of the kinematic equations which we were taught previously and see for ourselves just how effectively they model reality under relatively controlled circumstances with negligible air resistance.
Experimental Procedure for Part 1:
For this lab, we set up an apparatus depicted in the image below
Lifting the ring stand onto the table and then securing it to the table with a C-clamp, we proceeded to adjust a aluminum v-channel diagonally onto the ring stand with a specialized clamp, taking care to measure the angle between the v-channel and the table, shown below.

Then, off on the ground, we positioned a piece of carbon paper with tape, shown below

 Next, we rolled the ball down the v-channel five different times, each time releasing from the same position within the v-channel. We observed how the ball landed in nearly the same spot each time. Next, we proceeded to measure the height of the table, together with the distance from the table the ball landed in order to calculate the anticipated landing spot of the steel ball and the approximate launch speed. Furthermore, we likewise documented the uncertainty of our height and distance measurements, shown below.
Lists/Tables/Graphs of Collected Data with Explanation for Part 1:

From the information and calculations shown above, we showed the different horizontal distances the ball covered together with their uncertainties, followed by calculating the median distance of 0.7248 meters, which in turn is inputted into our standard kinematic equation, with the ratio between the horizontal distance covered and the desired initial velocity being substituted for time.When we solved for this desired initial horizontal velocity, we obtained a reasonable value of 1.66 m/s.
Experimental Procedure for Part 1:
Next, we slightly modified the experiment, depicted below. 
This time we were supposed to place a wooden plank diagonally, resting it against the edge of the table, setting up our apparatus to determine the distance d the steel ball will be covering under the same circumstances as the previous part, with the carbon paper wrapped around the wooden plank where we anticipated the ball would hit. Below is our set up. 
 First, we were first supposed to symbolically solve for d, then calculate it, then conduct the experiment five times in order to determine our experimental value for d, shown below.
Lists/Tables/Graphs of Collected Data with Explanation for Part 2:
From our work above, we see that, symbolically, d = (2sin(theta)*(V_0)^2)/(g*(cos(theta))^2)
Furthermore, when we carried out the calculation, we see that our calculated value of d is 0.72 plus/minus 0.1 meters, which is remarkably close to the 0.7248 meters we measured to be the horizontal distance covered by the steel ball during the first part of our experiment. 
Conclusion- Interestingly enough, our experimental values and calculated values were very close with minimal uncertainty. This is most likely due to the relative mechanical simplicity of the system, reducing the likelihood of error. Thus, we confirmed the effectiveness of the kinematic equations for modeling projectile motion.